by Ray Daniels (Brewing Techniques)
The articles featured in this section are sourced from Brewing Techniques Magazine. The content has been added without editing for authenticity and integrity.
.jpg)
Beer color, also referred to as beer SRM, represents a great void in the beer literature — little has been published on the topic, and few understand its theoretical or practical aspects. This article launches a three-part series on beer color with a review of color measurement methods. Coming in future issues: how color develops during brewing, how to predict it during recipe formulation, and how to control it in practice.
The topic of beer color has received little attention in the brewing literature over the past 40 years. The basic techniques for assessing and quantifying beer color were established in the 1940s and early 1950s, and since that time little additional discovery has taken place.
With this article, BrewingTechniques launches a three-part series that explores the assessment, prediction, and control of beer color. This first installment discusses the standards that have developed over the years for measuring beer color — both with and without laboratory instruments — and how small-scale brewers can determine the color values of their beers without sophisticated equipment and at little expense.
Next issue’s installment will examine the science of beer color — first the nature of light and color, and then the chemistry that gives rise to color in beer. The third installment will examine practical aspects of color in brewing, including the areas of the process that affect the color of the finished product. That article will conclude the series by offering techniques for predicting the finished color of a beer and providing specific steps to lighten or darken your beer.
Click here to browse some of our best selling all-grain brewing equipment!
The existing science of beer color deals only with ingredients and finished products and makes little if any attempt to predict the color of a beer based upon its recipe and brewing processes.
The reason for this is easy enough to understand: at least a dozen factors influence color, and none is a reliable, precise predictor of finished beer color. Further, the demands placed on color by the big brewers (for whom most research is conducted) are quite different from those of craft brewers. Most commercial brewers make the same product day after day, year after year. Because they produce the same recipe all the time, they have little need to predict the likely color of a new recipe formulation. When they do, it is all worked out in the pilot brewery.
The big breweries, however, do place very demanding color specifications on their finished beers. The allowable variation is in many cases <0.1 °SRM — a level below the lab-to-lab variability inherent in the measuring techniques. (SRM, or the Standard Research Method, is discussed below).
To achieve such close tolerances, most big breweries cheat a bit. Until the mid-1970s, they could use industrial caramel to adjust the color of the finished beer (caramel was subsequently outlawed because of supposed carcinogenicity). In addition, blending batches is fairly common; blending ensures the consistency of commercial beers along a variety of parameters, and color can often be adjusted this way. Finally, many of America’s best light lagers are dosed with minuscule amounts of roasted barley during the mash to bring the color into specification.
Craft brewers — and especially home brewers — place rather different demands on beer color. First, craft brewers demand less reproducibility in the finished product and are generally willing for final color to fall within a range rather than right on a specific SRM value. Second, the most common methods of control used by large-scale brewers are generally unavailable to home and commercial craft brewers. Certainly the production of pilot or test brews that are not intended for sale or consumption is virtually unknown. In addition, craft brewers have less opportunity to smooth out variations through blending.
Thus, what craft brewers need is to understand the theoretical and practical factors that influence color formation in beer and to devise a system that can be used in recipe formulation to give an estimate of the color that can be expected from a specific recipe. Before any of this can make sense, however, we need to understand how color is measured and what the various color measurement units mean.
To browse our extensive selection of brewing malt and grain, click here!
Determining beer and wort color has been troublesome in the malting and brewing industries for at least 100 years. Over the past 50 years, half a dozen techniques — each producing different results — have been used to assess and quantify the color of beer. To make matters worse, at least two of these methods have been used at various times by brewers in North America and Europe, making for further variations in color comparison.
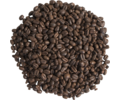
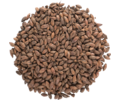
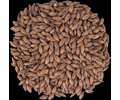
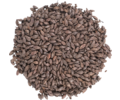
One of the big problems facing the assessment of beer and wort color analysis is the broad range of colors found in finished beer. After all, beers range in color from “light” beer to the blackness of Guinness stout. In addition, hues of both red and yellow contribute to beer color at all points along the spectrum, but the relative contribution of red and yellow to the finished color changes from beer to beer (see Figure 1). Worse, these proportions do not remain constant when beer is diluted with water.
These challenges have led to many changes in the measurement of beer color over the years. The original Lovibond system was created in 1883 by J.W. Lovibond and, at least in some implementations, involved the use of three hues of colored slides that were assembled in combinations until a color matching that of the beer was found. The term “degrees Lovibond” is still in use today (this article uses the more official °SRM to refer to this value). Indeed, today’s methods for determining color with some accuracy can be traced back to the original system.
For several decades, the basis for assigning color values was the visual comparison of a beer or wort sample against a colored glass standard (see Figure 2). For quite some time, brewers used a standard called the Series 52 Lovibond Scale. This system used a set of colored glass standards corresponding to Lovibond numbers and containing the hues thought to be most prevalent in beer. This system attempted to capture both the yellow/red balance and the overall intensity of a beer’s color with a single standard Lovibond rating.
Widespread use of this method, however, had a number of drawbacks. First, color blindness is somewhat common; it affects about 8% of males and 5% of females. Second, the color standards themselves turned out to vary from laboratory to laboratory, and certain inconsistencies could be found even within a single set of standards; in one documented instance, the color of two standards labeled with different values turned out to be identical. Other standards and photometer calibration methods were tried based upon iodine and potassium dichromate, but none proved ideal.
All this struggle for effective measuring tools predates the arrival of affordable, reliable spectrophotometers. These instruments allow you to precisely control light to select a single wavelength from the spectrum of visible light (about 400–700 nm), pass it through a sample, and measure the degree of transmission or absorbance. This tool became available to brewers in the 1940s and early 1950s, sparking a great deal of research on both sides of the Atlantic. The research, however, led to different results in Europe than it did in the United States.
In the United States, the standard method for determining beer color is the Standard Research Method (SRM), adopted by the American Society of Brewing Chemists (ASBC). This technique was originally set up to approximate the Lovibond scale and is now used as the basis for assigning Lovibond ratings to grains as well as to determine the actual color of finished beer.
Based on work done by Beyer, Stone, and a subcommittee of the ASBC, the ASBC had identified a method of direct color determination that provided good correlation with the visual methods. Most important, they noted that, compared with the visual method, the instrumental technique resulted in a much lower level of variation between operators and sites. Thus, in 1950 the ASBC’s subcommittee on color recommended adoption of a “standard reference color method” based upon spectrophotometer readings for the determination of beer color. Essentially unchanged, this method is the same one used today in the United States for determining SRM color values. Despite the official name of SRM, you will often still see the label Lovibond applied to results of color analyses based on this method.
In Europe, a researcher by the name of Bishop used the spectrophotometer as a tool for improving the visual Series 52 Lovibond standards. Studies began to show a good correlation between visual and instrumental methods, and the European Brewing Convention (EBC) adopted the new system of visual standards as their analytical method. The EBC color value of a beer analyzed using this system was quite different from the SRM color value for the same beer. Thus, the techniques and terminology of American and European brewers diverged, and it would take another 25 years before they would begin to come together again.
To confuse matters further, the British Institute of Brewing (IOB) adopted a spectrophotometric method using a wavelength entirely different (530 nm) from that used by the EBC or the Americans. This complication was finally resolved in 1991, when the IOB formally revised its standards to include the EBC measurement technique.
The ASBC method uses a spectrophotometer to assess the amount of light absorbed by beer in a 0.5-in. (1.25-cm) i.d. glass cuvette when illuminated with light at the specific wavelength of 430 nm; the SRM color rating is equal to 10 times this absorbance value. Because absorbance is a logarithmic scale, the maximum value (corresponding to 100% absorbance) is 2.0. This fact introduces some problems with evaluation of beers that are darker than 20 °SRM (this problem is discussed later in this article).
The EBC method assesses beer color by reading absorbance in a smaller, 1-cm (0.4-in.) cuvette, but at the same wavelength. To get the final color value, the absorbance is multiplied by 50. This technique was adopted in Europe only recently (14); previously, the EBC used a method that read absorbance at the longer wavelength of 530 nm. The current technique (reading at 430 nm) can be directly compared with the ASBC method as follows:
EBC = SRM * 3.94
or
SRM = EBC/3.94
In general use, a factor of about four can be applied for an approximate translation between the two systems. If you are looking at older EBC color values — especially those that may have originated in Britain — be cautious in making any comparisons between them and SRM color values. Because of the different color measurement techniques used, the results may not be directly comparable to current SRM values.
Visualizing the standards: How do these precise, quantitative measures relate to the types of color we actually see in beer? After all, knowing that a beer has an SRM color of 10 doesn’t do you much good if you don’t know what a 10 should look like!
A variety of charts provide verbal descriptions of SRM color; few, however, explicitly state the conditions under which the beers are to be observed. This variable is important because visual perception of beer color depends upon many factors, including the diameter and depth of the glass used for viewing and the source and the character of the light by which it is viewed. Also, I find many of the descriptors used in these charts confusing.
At the risk of repeating these errors, Table I provides qualitative descriptions for the range of SRM colors based on the use of the standard American Homebrewers Association (AHA) beer judging cup.* The cup generally contains 1–2 in. of beer when color is observed. The best light is sunlight reflected off of a white sheet of paper. Other bright but diffuse sources may be used.
The descriptions in Table I are based on analysis of the various style guidelines published by the Association of Brewers. The table includes examples of some well-known beers to provide visual references for the meaning of the descriptions.
*The judging cup is a clear hard plastic cup, ~4 in. high, ~2.25 in. in diameter at the base and ~2.875 in. in diameter at the top.
table i
|
Correlation of SRM Values to Qualitative Descriptions |
||
|
Description |
Color (°SRM) |
Example |
|
Very pale |
2–3 |
Budweiser (2) |
|
Pale |
3–4 |
Molsen Export Ale (4) |
|
Gold |
5–6 |
|
|
Amber (brownish yellow) |
6–9 |
Bass Ale (9.8) |
|
Deep amber/light copper |
10–14 |
Whitbread Pale Ale (11) |
|
Copper (reddish brown) |
14–17 |
|
|
Deep copper/light brown |
17–18 |
Michelob Dark (17) |
|
Brown |
19–22 |
Salvator (21) |
|
Dark brown |
22–30 |
|
|
Very dark brown |
30–35 |
|
|
Black |
30+ |
|
|
Black, opaque |
40+ |
Most Stouts |
 |
Have any feedback on this article? We want to hear from you! Click here, to contact us with any feedback. Did you enjoy reading this article? Interested in writing one? Click here, to learn More! About becoming a contributor. Or simply email us at articles@morebeer.com |
Knowing that the big boys assess beer color with a spectrophotometer is fine, but it doesn’t do the average home or craft brewer much good. Of course, you could send your beer off to one of the beer laboratories for a color analysis. For $ 10–15, you could find out your beer’s exact SRM color value to within a tenth of a degree. But that isn’t very practical — or necessary. What’s needed is an easy, reliable way to assess the color of a finished beer when sitting in the comfort of your own home or brewery.
Several approaches to this challenge are possible, each of which uses a system of comparison by which the unknown sample (your beer) is visually compared with a standard or standards of known SRM value.
Procedures: Each method requires you to follow a common set of standard procedures for all of the beer involved (both standards and unknowns). These procedures include the following:
· Pour 1–2 in. of beer into a clear plastic cup or standardized glass container, labeled as appropriate with the identity of that beer. (The container used and the level of beer should be approximately the same for all samples.)
· Pour to maximize foaming and then swirl the beer a few times to release additional gas. Repeat swirling as necessary.
· When no visible gas bubbles remain, you are ready to begin.
· Compare standards and unknowns in front of a white sheet of paper illuminated with daylight or a high-intensity lamp.
Standards: What options do you have for using established standards against which to read your beers? The first method — using a hand-held card — is very quick and easy but requires a specific tool. The others — using beers — are a bit more involved but may be more readily available. Differences in red/yellow balance are found in each method, so no one approach is perfect for reading all beers.
The first approach uses a commercially available hand-held card made with photographic film to provide standards for 10 ratings ranging from 3 to 19 °SRM. (Since color in a batch varies from time to time, the card is recalibrated; the 10 ratings represent the most current card available.) The card was created by home brewer Dennis Davison (Davison Manufacturing, Greenfield, Wisconsin) for use in comparing beers viewed in the standard AHA competition cup.
To use the device, pour about 1 in. of beer into the cup and hold the cup and the card of color panels side-by-side in front of a diffuse daylight source (Figure 3). The values of the 10 color panels, in SRM degrees, are 3, 5, 6, 7, 8, 9, 11, 14, 17, and 19. By comparing the color of your beer to the transparent color panels on the card, you can determine the color of your beer to within about 1 °SRM.
I used one of these cards extensively during my research and found that it provided a reasonably accurate result very quickly. The difficulties I encountered involved the qualitative aspects of some of the panels (red/yellow balance) and the challenges of interpolating values that lie between the standard panels — especially between 11 and 14 °SRM. Nonetheless, I found the correlation between this method and instrumental readings to be very high.
If you don’t have access to the Davison guide, you can use any one of a number of methods that rely on commercial beers as the color standards. One such method, described by George Fix, compares the unknown beer to dilutions of Michelob Classic Dark. I have difficulty finding Michelob Classic Dark in my area, so I have devised a similar technique using the German Doppelbock, Salvator.
As shown in the next section (see “Assigning Color for Very Dark Beers”), dilutions of dark beer give nonlinear results, which means you must read the SRM value of the diluted standard off of a curve (see Figure 4). If Michelob Dark is easier for you to find, Table II shows the dilutions needed to produce a good set of standards.
Occasionally, you may want to read a number of beers in one sitting. Again assuming that you don’t have access to the Davison card, you will want to prepare a set of beer-based standards that cover a broad range of SRM colors for use in your comparisons. This range of colors will allow you to read each sample fairly quickly and will ensure that you have a common standard for all of the data that you generate.
The first step is to assemble a group of beers that have well-documented color values and use them as standards. Using the data provided in Table I and any data you can find through other sources, it is possible to assemble a set of beers that provide you with a reasonable “standard curve” from which you can read the colors of your beers. I find that Budweiser, Molson Export Ale, Bass Ale, and either Michelob Dark or Salvator give a reasonable set of standards.
table ii
|
Creating SRM Color Standards by Dilutions of a Single Dark Beer |
|||
|
Michelob Dark (20 mL)* |
Salvator (20 mL)† |
||
|
Distilled Water |
Color |
Distilled Water |
Color |
|
Added (mL) |
(°SRM) |
Added (mL) |
(°SRM) |
|
0 |
17 |
0 |
21 |
|
10 |
15 |
15 |
15 |
|
25 |
12.5 |
24 |
12.5 |
|
40 |
10 |
40 |
10 |
|
70 |
7 |
60 |
7.5 |
|
100 |
5 |
120 |
5 |
|
250 |
2 |
— |
— |
|
*Source: Reference 18. †Source: Reference 23. |
|||
Another approach to making standards would be to set up a series of dilutions of a dark beer similar to the Fix test mentioned above. Table II shows the ratios to use in making standards from either Michelob Dark or Salvator. Oxidation of samples will degrade color over time, so it is important that samples be fresh.
If you find that making these dilutions is a bit too tedious, you can also make a good set of standards from mixtures of just three beers. In contrast to dilutions with water, intermixtures of certain beers provide a progression of color samples that is very close to linear. Thus, using Salvator (21 °SRM), Bass (9.8 °SRM), and Spaten Club Weiss (4.6 °SRM), you can create a full set of color standards. (Note: Dilutions of Salvator with Club Weiss are not linear.) Table III provides a simple method that requires no complicated mixing: each beer is used undiluted and then mixed half and half (1:1) with another. These standards provide pretty good coverage of the whole range of SRM values from 2 to 20.
table iii
|
Using Beer Combinations to Create Color Standards |
|
|
Beer or Beer Combination |
Color (°SRM) |
|
Salvator (undiluted) |
21 |
|
Half Salvator, half Bass |
15.4 |
|
Bass |
9.8 |
|
Half Bass, half Club Weiss |
7.2 |
|
Club Weiss |
4.6 |
|
Half Club Weiss, half distilled water |
2.3 |
You need only 2–4 oz of each standard if you use the AHA cups for making the comparisons — you will have plenty of Salvator and Club Weiss left over to enjoy as you measure the colors of your beers.
As you can see, a number of techniques are available for easily measuring beer color. All of the standards and dilutions have been checked by photometer to ensure that they provide accurate results. Be aware, however, that even commercial beers can vary — or even change intentionally. If something doesn’t seem right, double check it using a different method or a different beer as a standard.
The scales cited in the previous section allow you to read beers up to only 17 or 21 °SRM before running out of standards with which to compare. Most porters, all stouts, and a variety of scotch ales, Bocks, milds, and even some Weizenbocks exceed the limits of these systems.
The logical solution is to dilute these darker beers so that they fall below 17 or 21 and can therefore be read within the scale of the standards. But beware — dilution of dark beers lands you in the blurry world of beer color confusion.
The problem, ultimately, is that — incredible as it may seem — beer does not always follow Beer’s Law. Beer’s Law, named after its discoverer August Beer, states that there is a linear relationship between the concentration of a solution and the amount of light that it absorbs or transmits when read in a spectrophotometer. Over the years, several authors have asserted that beer obeys Beer’s Law. Unfortunately, these studies appear to have examined a very limited portion of the beer color universe. It appears that Beer’s Law does hold true for beers with a final color of less than 5 or perhaps up to 10 °SRM.
The reality of nonlinearity can be demonstrated by checking the colors of various dilutions of a beer on a spectrophotometer and comparing them with the expected (linear, Beer’s law) results. Figure 5 shows that Spaten Club Weiss, with an initial color of 4.6 °SRM does, in fact, give a linear dilution profile and thus complies with Beer’s law. More highly colored beers, however, clearly do not comply with Beer’s law. Figure 6 shows dilutions completed on six dark beers. The absorbance readings (indexed for the figure) from these beers diverge substantially from the linear profile predicted by Beer’s Law.
These results agree with the data that Fix presents on Michelob Dark and its lack of linearity. As can be seen in these six samples, even the nonlinearity is not consistent between samples.
This failure of beer to comply with Beer’s Law is important because it affects the color values assigned to beers with a color above 20 °SRM. In the laboratory, color is determined by multiplying the spectrophotometer reading times 10. But because the maximum absorbance that can be read on these instruments is 2.0, any beer darker than 20 must generally be diluted or read in a smaller cell (this is also true in the visual systems described earlier in the article). In either case, Beer’s law must be applied to give the final reading.
Thus, a failure in Beer’s Law means that the assigned color of a dark beer will vary according to the dilution (or cell size) selected. In the example provided in Table IV, the color of “Porter 132,” after using Beer’s Law to correct for the dilutions, could be assigned different color values after each dilution.
The physical or chemical phenomenon responsible for this behavior has not been characterized in the beer literature (24). Based on other investigations into the failure of Beer’s Law, however, it has been postulated that the melanoidin pigment compounds in beer form complexes when present at high concentrations. After dilution, the complexes dissociate into products that absorb more light than the complexes themselves.
Despite these problems with dilution, several sources have confirmed that it is common practice in beer laboratories to dilute dark beers or worts and determine their color by assuming that Beer’s Law does hold true.
The only guidance on this practice provided by the ASBC method is a statement that the ideal range for reading absorbance would be 0.187 to 0.699, because this range provides the highest accuracy. This statement would suggest that any beer over 7 °SRM might be diluted before being read — not all laboratories or technicians follow this practice. Unless a standard dilution is used, a single beer may receive different readings from different laboratories or even from the same lab on different days. Anyone trying to control color on any beer with more than a smidgeon of color should be aware of this possibility.
table iv
|
Unreliability of Applying Beer’s Law to Diluted Dark Beers |
|
|
Divergent Readings for “Porter 132” |
|
|
Dilution |
Final Color (°SRM) |
|
Undiluted |
28* |
|
1:1 |
40.4 |
|
1:3 |
54 |
|
1:7 |
65.6 |
|
1:11 |
68.4 |
|
*This undiluted beer was read in a 1-cm cell at A420, as all of my photometer readings were. It gave an absorbance of 1.650. |
|
In my studies, beer to water dilutions of 1:7 and 1:11 for the porter fall within the ASBC-recommended absorbance range. Interestingly, they give SRM values that are fairly close to each other. This result is most likely due to the approach of an end point in the physical dissociation of the pigment complexes at these dilution levels. Support for this assumption can be drawn from the fact that the dilution curves for all the dark beers I tested begin to approach the Beer’s Law line again in dilutions greater than 10.
All of these data suggest that when assessing the color of dark beers by either visual or photometric methods, you need to select a standard dilution factor and stick with it. The results of such readings may be surprising — according to this method, some of the stouts I read would have colors in excess of 100 °SRM. Despite this, a series of such readings will at least provide a meaningful basis for comparison and provide the basis for process control (if this is desired) by increasing reproducibility from reading to reading.
In my work, I have used a 1:11 dilution factor for both photometric and visual readings of dark beers, and this method seems to work reasonably well. A typical dilution would be 4 mL of beer to 44 mL of distilled water. The color value obtained for this solution would then be multiplied by 12 (the total number of parts) to give the color of the undiluted beer.
A variety of systems for evaluating beer color have been developed over the years, resulting in two major standards — SRM units (United States) and EBC units (Europe). Worldwide, most breweries follow one of these two major systems. Although sophisticated laboratory instruments can provide precise analytical results, fairly accurate estimates of beer color can also be obtained in the home or small craft brewery.
Now that we can measure the color of our beers, our thoughts turn to how that color is developed during the brewing process. And what steps can be taken to control and predict the color of finished beer? These topics will be undertaken in the second and third articles of this series.

All contents copyright 2024 by MoreFlavor Inc. All rights reserved. No part of this document or the related files may be reproduced or transmitted in any form, by any means (electronic, photocopying, recording, or otherwise) without the prior written permission of the publisher.


.png)
.png)
(1).png)
.png)